Launch Your Data Career with Confidence

Data Analytics with Generative AI (Job Guarantee Program)

This comprehensive, project-driven course prepares you to become a modern data analyst—equipped not only with technical tools like Excel, SQL, Python, and Power BI, but also with the power of AI automation using tools like ChatGPT and Copilot. Designed for career transitions and fresh graduates, this program includes full placement support.

4 Months

Intensive Curriculum (200+ Hours)

12+ Projects

With Real Data Sets

Job Guarantee

With Dedicated Career Support

ReGain Learning

Data Analytics Key Highlights

200+ Hours instructor led online training

• World-Class Instructors
• Expert-Led Mentoring Sessions

Excel, SQL, Python, Power BI – All in One Program

• 10 Hours of Application
• Hands-on Practice
• Skill-Building Tasks

Learn to Use Copilot & ChatGPT for Analytics & Automation

• Step-by-step Guidance
• Remote Assistance
• Compatible Setup

Industry standard curriculum

• Industry-Recognized Certificate
• Boosts Credibility
• Proof of Skill

Life time access for Recording classes

• Unlimited Access
• Learn at Your Pace
• Continuous Updates

12 Hands-on Projects + Capstone Dashboard

• Never Miss a Session
• Rewatch Anytime
• Lifetime Learning

Realtime Training

• Instant Doubt Resolution
• Live Interactive Sessions
• Practical Learning

Industry Expert Trainer

• Led by Professionals
• Insights from the Field
• Up-to-date Knowledge

Flexible Schedule

• Boosts Credibility
• Learn at Your Convenience
• Balance Work and Study

Software Installation support

• Aligned with Market Needs
• Covers In-Demand Skills
• Regularly Updated Content

ReGain Learning

Our Personalized Course Curriculum

Data Analytics Course Syllabus

Module 1: Hands-on Session [10 hrs]

  • Introduction to Power BI Desktop
  • Introduction to Power Query and Data Profiling Techniques (E-commerce Data)
  • Query Parameters in Detail
  • Direct Query vs Import Data Connection Mode

Module 2: Power BI Desktop Visualizations [10 hrs]

  • Creating visuals (hands on understanding of Each visual with proper working and it’s
  • Use Cases along with all the formatting option around the Visual) Ecommerce Data
  • Stacked Bar chart & Column chart
  • Clustered Bar chart & Column Chart
  • 100% Stacked Bar chart & Column Chart
  • Line Chart with formatting option
  • Line chart with Forecasting
  • Line Chart with Add further Analysis using Constant Lines
  • Area Chart & Stacked Area Chart
  • Waterfall Chart ,Ribbon Chart & Funnel Chart
  • Tree Map Visuals
  • Gauge Visuals
  • Maps in visualization (Normal Map, Filled Map & Shape Map)
  • Understanding Types of Filters Available in Power Bi(Page, all Pages & Visual Level Filter

Module 3: Data Modelling with Power BI [10 hrs]

  • Introduction to Data Modelling & Data Warehousing Concept along with Realtime example
  • Creating hierarchy in the model
  • Understanding Cross Filter Direction & Cardinality
  • Why do we need Date Table in Power Bi?

Module 4: DAX Expressions [12 hrs]

  • Introduction to Dax (how to write Dax and basic functions in power bi)

Module 5: Publishing and Sharing [8 hrs]

  • Publishing and Sharing
  • Publish from Power BI desktop to Saas Account
  • Sharing Reports and Dashboards
  • Manage Subscription & Alert in Power Bi
  • Creating Live PPT's Via Power BI Reports
  • Workspaces in Details (Creation and Roles in Workspace)
  • Creating Dashboards
  • Printing, PDF’s , Live PPT’s and exports
  • Realtime Exercise: -
  • Understanding Row Level Security and Establishing Security with Regional and
  • Segment Based Manager on Sales Data
  • Establishing on Premise Gateway
  • Scheduling Manual & Automated Refresh

Section 1:

  • Introduction to Excel & Power Query for Data Study
  • Understanding the Excel Interface, Customizing the Ribbon, Excel Shortcuts

 Section 2:

  • Basic Formulas and functions
  • SUM, AVERAGE, MIN, MAX, Basic Arithmetic Operations

Section 3:

  • Data Entry and Formatting
  • Cell Formatting, Data Validation, Conditional Formatting

Section 4:

  • Advanced Formulas and Functions
  • IF, AND, OR, Nested Formulas, Text Functions
  • Lookup Functions
  • VLOOKUP, INDEX and MATCH

Section 5:

  • Data Analysis Tools
  • Pivot Tables, Pivot Charts, Data Consolidation
  • Introduction to Macros Recording Macros
  • Excel with AI
  • Using AI in Excel
  • Excel AI Capabilities, Implementing AI Tools
  • Practical Applications of Co-Pilot with Excel

Section 1: Microsoft SQL Database Server

  • Introduction (30 mins)
  • What is T-SQL
  • What is SQL Server
  • Minimum SQL Server Installation Requirements
  • SQL Server Editions
  • SQL Server Download
  • SQL Server Installation
  • Connecting to SQL Server with SSMS
  • Install Sample Database
  • Basic Database Concepts
  • Creating Simple Table in SQl and Inserting Values
  • Constraints in SQl

 Section 2: Microsoft SQL CRUD Operations

  • What is CRUD
  • Creating a new database
  • Creating a new table
  • Reading Data from table
  • Views
  • Updating Records
  • deleting records
  • Truncating a Table
  • Stored Procedures
  • Dropping a Table
  • Dropping a database
  • Backing up database
  • Restoring a database

Section 3: Microsoft SQL (T-SQL)

  • TOP Command
  • GO Command
  • USE Command
  • DISTINCT AND TOP

 Section 4: Filtering Data (Scenario Based Learning)

  • Introduction
  • Filtering data with equality filters
  • Filtering data with basic comparison filters
  • Filtering data with logical comparison filters
  • Filtering data with string comparison filters

 Section 5: Filtering data with string comparison filters

  • Introduction
  • ordeR BY Clause
  • Sorting by Ascending
  • Sorting by Ascending
  • Sorting by multiple columns

Section 6: Extracting data from Multiple Tables using Joins

  • Introduction
  • Why is Table Join Necessary?
  • INNER JOIN
  • LEFT OUTER JOIN
  • RIGHT OUTER JOIN
  • Cross JOIN

Section 7: Aggregate Functions (Scenario Based Learning)

  • Introduction
  • COUNT
  • AVG
  • MAX
  • MIN
  • SUM
  • Using Multiple Aggregate Functions
  • Grouping Data with GROUP BY Clause

 Section 8: Additional Topics (Advanced Scenario Based Learning)

  • Sub Query
  • String Function
  • Finding Nth Character
  • Rownum & Partition in Sql Along With Rank
  • Stored Procedures in Sql Server
  • Set Operators
  • Scalar Functions
  • SQL String Function

ChatGPT for SQL Optimization

  • Auto SQL Query Generation
  • Debugging SQL using ChatGPT
  • Best Prompts for SQL Automation

Basic Introduction Of Python

Python Installation

 Variable [1 hr]

  • Local Variable
  • Global Variable

 Data Type, Variables & How to define it? [1hr]

  • Boolean
  • String
  • Integer
  • Float

 Data Structure [1 hr]

  • List / Array
  • Dictionary
  • Tuple
  • Set

 Condition & Loops [1 hr]

  • f - Elif - Else Statement
  • For Loop
  • While Loop
  • d For Loop

Functions [3 hr]

  • print()
  • sum()
  • max()
  • min()
  • range()
  • sorted()

 Special Functions  [2 hrs]

  • lambda()
  • filter()
  • map()

Class [2 hrs]

  • Function
  • Object
  • Function Calling

 Program Writing [3 hrs]

  • Programs on List
  • Programs on Dictionary
  • Programs on String

Basic Introduction Of Numpy

 Data Types [2 hrs]

  • int
  • str
  • object
  • datetime
  • nan

 Numpy Functions [3 hrs]

  • arange()
  • array()
  • append()
  • sum()
  • min()
  • max()
  • abs ()
  • sqrt ()
  • product()
  • dot()
  • round()
  • ceil()
  • isnan()
  • where()

 Slicing [1 hr]

  • Row Slicing
  • Column Slicing
  • Element Slicing

Basic Introduction Of Pandas

 Read Data [1 hr]

  • read_csv()
  • read_excel()

 Write Data [1 hr]

  • DataFrame.to_csv()
  • DataFrame.to_excel()

 Pandas Functions [3 hrs]

  • Series()
  • DataFrame()
  • DataFrame.describe()
  • DataFrame.info()
  • isna()
  • concat()
  • merge()
  • melt()
  • pivot_table()
  • DataFrame.append()
  • DataFrame.groupby()
  • DataFrame.max()
  • DataFrame.min()
  • DataFrame.sort_values()
  • DataFrame.reset_index()

Pandas Operations [2 hrs]

  • Slicing
  • Filter Data For Specific Row
  • Filter Data For Specific Column
  • Filter Data For Specific Row & Column Combination
  • Create Calculated Column
  • Data overwrite

Basic Introduction Of Matplotlib

 Matplotlib Charts [2 hrs]

  • Line Chart
  • Pie Chart
  • Histogram Chart
  • Scatter Plot
  • Bar Plot
  • Box Plot
  • Sub Plot
  • Python Hands on Real Time Project with Industry Example (5 hrs)

Introduction to Prompt Engineering

 Goal: Understand what prompt engineering is and why it matters.

 Topics:

  • What is Prompt Engineering?
  • How LLMs (like GPT) understand and respond
  • Types of prompts: Zero-shot, One-shot, Few-shot
  • Key capabilities of LLMs: Text generation, summarization, Q&A,
  • classification, etc.
  • Limitations and biases of language models

 Hands-On Activities:

  • Try basic zero-shot and few-shot prompts using ChatGPT or OpenAI Playground
  • Prompt comparison: Vague vs specific

Designing Effective Prompts

 Goal: Learn techniques for crafting better prompts.

 Topics:

  • Prompt structure: Instructions, context, examples, format hints
  • Step-by-step prompting
  • Role prompting (e.g., “You are a helpful tutor…”)
  • Output control: Tone, format, length
  • Common prompt engineering mistakes

 Hands-On Activities:

  • Rewrite prompts for clarity and precision
  • Generate structured outputs (e.g., JSON, tables)

Advanced Prompt Techniques

 Goal: Deepen your understanding with more complex strategies.

 Topics:

  • Chain-of-thought prompting
  • Self-reflection and critique prompting
  • Prompt chaining (multi-step prompts)
  • Using system and user roles (ChatGPT format)
  • Using temperature, top_p, and other settings

 Hands-On Activities:

  • Solve logic problems with chain-of-thought
  • Compare results with different temperatures

Prompting for Different Use Cases

 Goal: Explore prompt applications across domains.

 Topics:

 Prompts for:

 i.Text summarization

 ii.Translation

 iii.Code generation

 iv.Sentiment analysis

 v.Data extraction

 vi.Educational tutoring

 vii.Business email writing

 Hands-On Activities:

  • Build domain-specific prompt examples (Choose: Business / Education /Programming)
  • Create a mini prompt library (template bank)

Real-world Projects & Tools

 Goal: Apply knowledge in real workflows and tools.

 Topics:

  • Overview of tools: ChatGPT, OpenAI Playground, Claude, Gemini
  • Using prompts in:

i.Excel / Google Sheets with AI plugins

ii.Power BI with Copilot (context-aware prompts)

iii.No-code AI tools like Zapier + OpenAI

  • Introduction to prompt evaluation and testing

 Mini Project Options: Build a chatbot-like prompt flow

 Create a prompt-based tutor/quiz assistant

 Automate a task using prompt templates

Module 1: Intro to Statistics & Types of Data (1 hour)

 Topics:

  • Descriptive vs Inferential Statistics
  • Population vs Sample
  • Types of Data (Numerical, Categorical)
  • Levels of Measurement (Nominal, Ordinal, Interval, Ratio)

 Module 2: Descriptive Statistics (2 hours)

 Topics

  • Central Tendency: Mean, Median, Mode
  • Dispersion: Range, Standard Deviation
  • Visualizing with Histograms, Boxplots

 Module 3: Probability & Distributions (1.5 hours)

 Topics:

  • Basic Probability Rules
  • Introduction to Distributions: Normal, Binomial
  • Central Limit Theorem (concept only)

 Module 4: Inferential Statistics (2.5 hours)

 Topics:

  • Hypothesis Testing Basics: Null, Alternative, p-value
  • T-tests (1-sample and 2-sample)
  • Confidence Intervals

 Module 5: Correlation & Regression (2 hours)

  • Correlation vs Causation
  • Pearson Correlation
  • Simple Linear Regression
  • R-squared interpretation

 Module 6: Mini Project & Recap (1 hour)

 Topics:

  • Choose a dataset (sales, customer, HR, etc.)
  • Do EDA + describe key insights
  • Run a basic hypothesis test or regression

Module 1: Sheets Essentials + Basic Formulas (1.5 hours)

 Topics:

  • Navigating Google Sheets: rows, columns, sheets
  • Formatting: wrap text, freeze panes, data types
  • Simple math: +, -, *, /
  • Functions: SUM(), AVERAGE(), COUNT(), IF()

 Module 2: Data Cleaning & Lookup Functions (1 hour)

 Topics:

  • Clean text: TRIM(), SPLIT(), SUBSTITUTE()
  • Remove duplicates
  • Lookup basics: VLOOKUP(), IFERROR()
  • Sort and Filter data

 Module 3: Data Summarization with Pivot Tables (1 hour)

 Topics:

  • Create pivot tables from a raw dataset
  • Summarize sales by region, month, etc.
  • Use calculated fields in pivot
  • Quick filters in pivots

 Module 4: Charts & Dashboards (1 hour)

 Topics:

  • Create charts: bar, line, pie
  • Sparkline for quick visuals
  • Link charts to pivot tables
  • Dashboard layout tips (titles, spacing, interactivity)

 Module 5: Collaboration + Importing Data (0.5 hour)

 Topics:

  • Sharing sheets with permissions
  • Comments & version history
  • Importing data: Google Forms, CSV, IMPORTRANGE()

 Module 6: Quick Project (1 hour)

  • Mini Project Options: Build a dashboard for mock sales data
  • Create a cleaned, summarized, and visualized version of form submissions
  • Use pivot + chart to track expenses or grade

Module 1: Introduction to Git & GitHub (1 hour)

 Topics:

  • Why use Git in data analysis?
  • Git vs GitHub: what’s the difference?
  • Version control for notebooks, scripts, datasets
  • Install Git and set up GitHub account

 Module 2: Git Basics – Local Workflow (1.5 hours)

 Topics:

  • Git init, status, add, commit
  • Checking history with log
  • File tracking (.csv, .ipynb, .py, .xlsx)
  • Creating a .gitignore for large data files

 Module 3: Working with GitHub (1.5 hours)

 Topics:

  • Create a remote GitHub repo
  • Pushing local project to GitHub
  • Cloning from GitHub
  • pull vs fetch
  • Syncing changes between local & remote

Module 4: Collaboration & Branching (2 hours)

  • Branching: checkout, merge, rebase (basic)
  • Pull Requests (PR): creating and reviewing
  • Resolving merge conflicts
  • GitHub Issues & Project Boards (basic overview)

 Module 5: Best Practices for Data Analysts (1–1.5 hours)

 Topics:

  • Project folder structure for analysis
  • Committing datasets – when and when not to
  • Writing good commit messages
  • Using GitHub for portfolio and showcasing projects
  • Using GitHub Pages to publish results

Module 1: Introduction to R & RStudio (1.5 hours)

 Topics:

  • Why use R for data analysis?
  • Installing R and RStudio
  • RStudio interface: scripts, console, environment
  • Basic syntax: variables, data types, operators
  • Writing and executing simple scripts
  • Hands-on: Create and run a basic script that performs calculations

 Module 2: Data Structures in R (2 hours)

 Topics:

  • Vectors, Lists, Matrices, Data Frames, Factors
  • Indexing and subsetting
  • Basic data type conversions
  • Hands-on: Create and manipulate vectors, data frames

 Module 3: Data Import, Export & Cleaning (2.5 hours)

 Topics:

  • Importing CSV, Excel using readr, readxl
  • Exporting datasets
  • Handling missing values: is.na(), na.omit()
  • Renaming, recoding, filtering data
  • Hands-on: Clean a messy CSV file using dplyr

 Module 4: Data Manipulation with dplyr & tidyr (3 hours)

 Topics:

  • select(), filter(), mutate(), arrange(), summarise(), group_by()
  • Combining data: left_join(), bind_rows()
  • Tidying data: pivot_longer(), pivot_wider()
  • Hands-on: Summarize sales/HR data using dplyr pipelines

 Module 5: Data Visualization with ggplot2 (3 hours)

 Topics:

  • Grammar of graphics basics
  • Scatter plots, bar plots, histograms, boxplots
  • Aesthetic mappings and facets
  • Customizing themes and labels
  • Hands-on: Visualize trends in data using different plots

Module 6: Descriptive & Inferential Statistics (3 hours)

 Topics:

  • Mean, Median, Mode, SD, IQR using summary() and psych package
  • Frequency tables, proportions
  • Hypothesis Testing: t-test, chi-square test, correlation
  • Confidence intervals
  • Hands-on: Perform statistical summary and tests on sample datasets

 Module 7: Linear Regression & Modeling (2.5 hours)

 Topics:

  • Simple and Multiple Linear Regression using lm()
  • Model diagnostics: R-squared, residuals
  • Predicting with new data
  • Visualizing regression lines with ggplot2
  • Hands-on: Predict sales or prices from input variables

 Module 8: Projects & Best Practices (2.5 hours)

 Topics:

  • Structuring R projects using RStudio Projects
  • Writing reusable code with functions
  • Using RMarkdown for reporting
  • Project ideas: sales report, churn analysis, survey analysis
ReGain Learning

Why Choose ReGain Learning ?

Choose ReGain Learning for a holistic and empowering educational experience that propels you towards your career goals.

Tailored Learning Paths

At ReGain Learning, we understand that every learner is unique. Our platform offers personalized learning paths to cater to your individual needs, ensuring a customized educational experience.

Recognition and Certification

Your accomplishments at ReGain Learning are recognized with industry-validated certifications. Showcase your skills to potential employers and stand out in the professional landscape.

Industry-Expert Mentors

Benefit from 1:1 mentorship with seasoned professionals who bring real-world insights to your learning journey. ReGain Learning connects you with industry experts who guide you towards success.

Data is at the center of every decision today. This program bridges analytics with automation to help you enter the data industry with confidence—and stand out.

Why learners choose this course:

  • End-to-End Curriculum – Tools + AI + Projects + Job Prep

  • Job Ready Portfolio – 12 Projects + Capstone + GitHub

  • AI First Approach – Learn Copilot, ChatGPT, Code Interpreter

  • Expert Support – Industry Mentors & Trainers

  • 100% Placement Support – Interviews, Feedback, Referrals

  1. User-Friendly Interface – Easily create interactive dashboards and reports without extensive coding knowledge.
  2. Data Connectivity – Connect to a wide range of data sources, including Excel, SQL Server, cloud services, and more.
  3. Advanced Data Visualization – Use intuitive charts, graphs, and AI-powered insights to make informed business decisions.
  4. Automation & Real-Time Analytics – Automate data refreshes and monitor real-time metrics.
  5. Career Growth & Demand – Power BI professionals are in high demand across industries, making it a valuable skill for career advancement.
  6. Seamless Integration – Integrates with Microsoft tools like Excel, Azure, and Teams for enhanced productivity.
  7. Cost-Effective Solution – Compared to other BI tools, Power BI offers a scalable and affordable analytics solution.

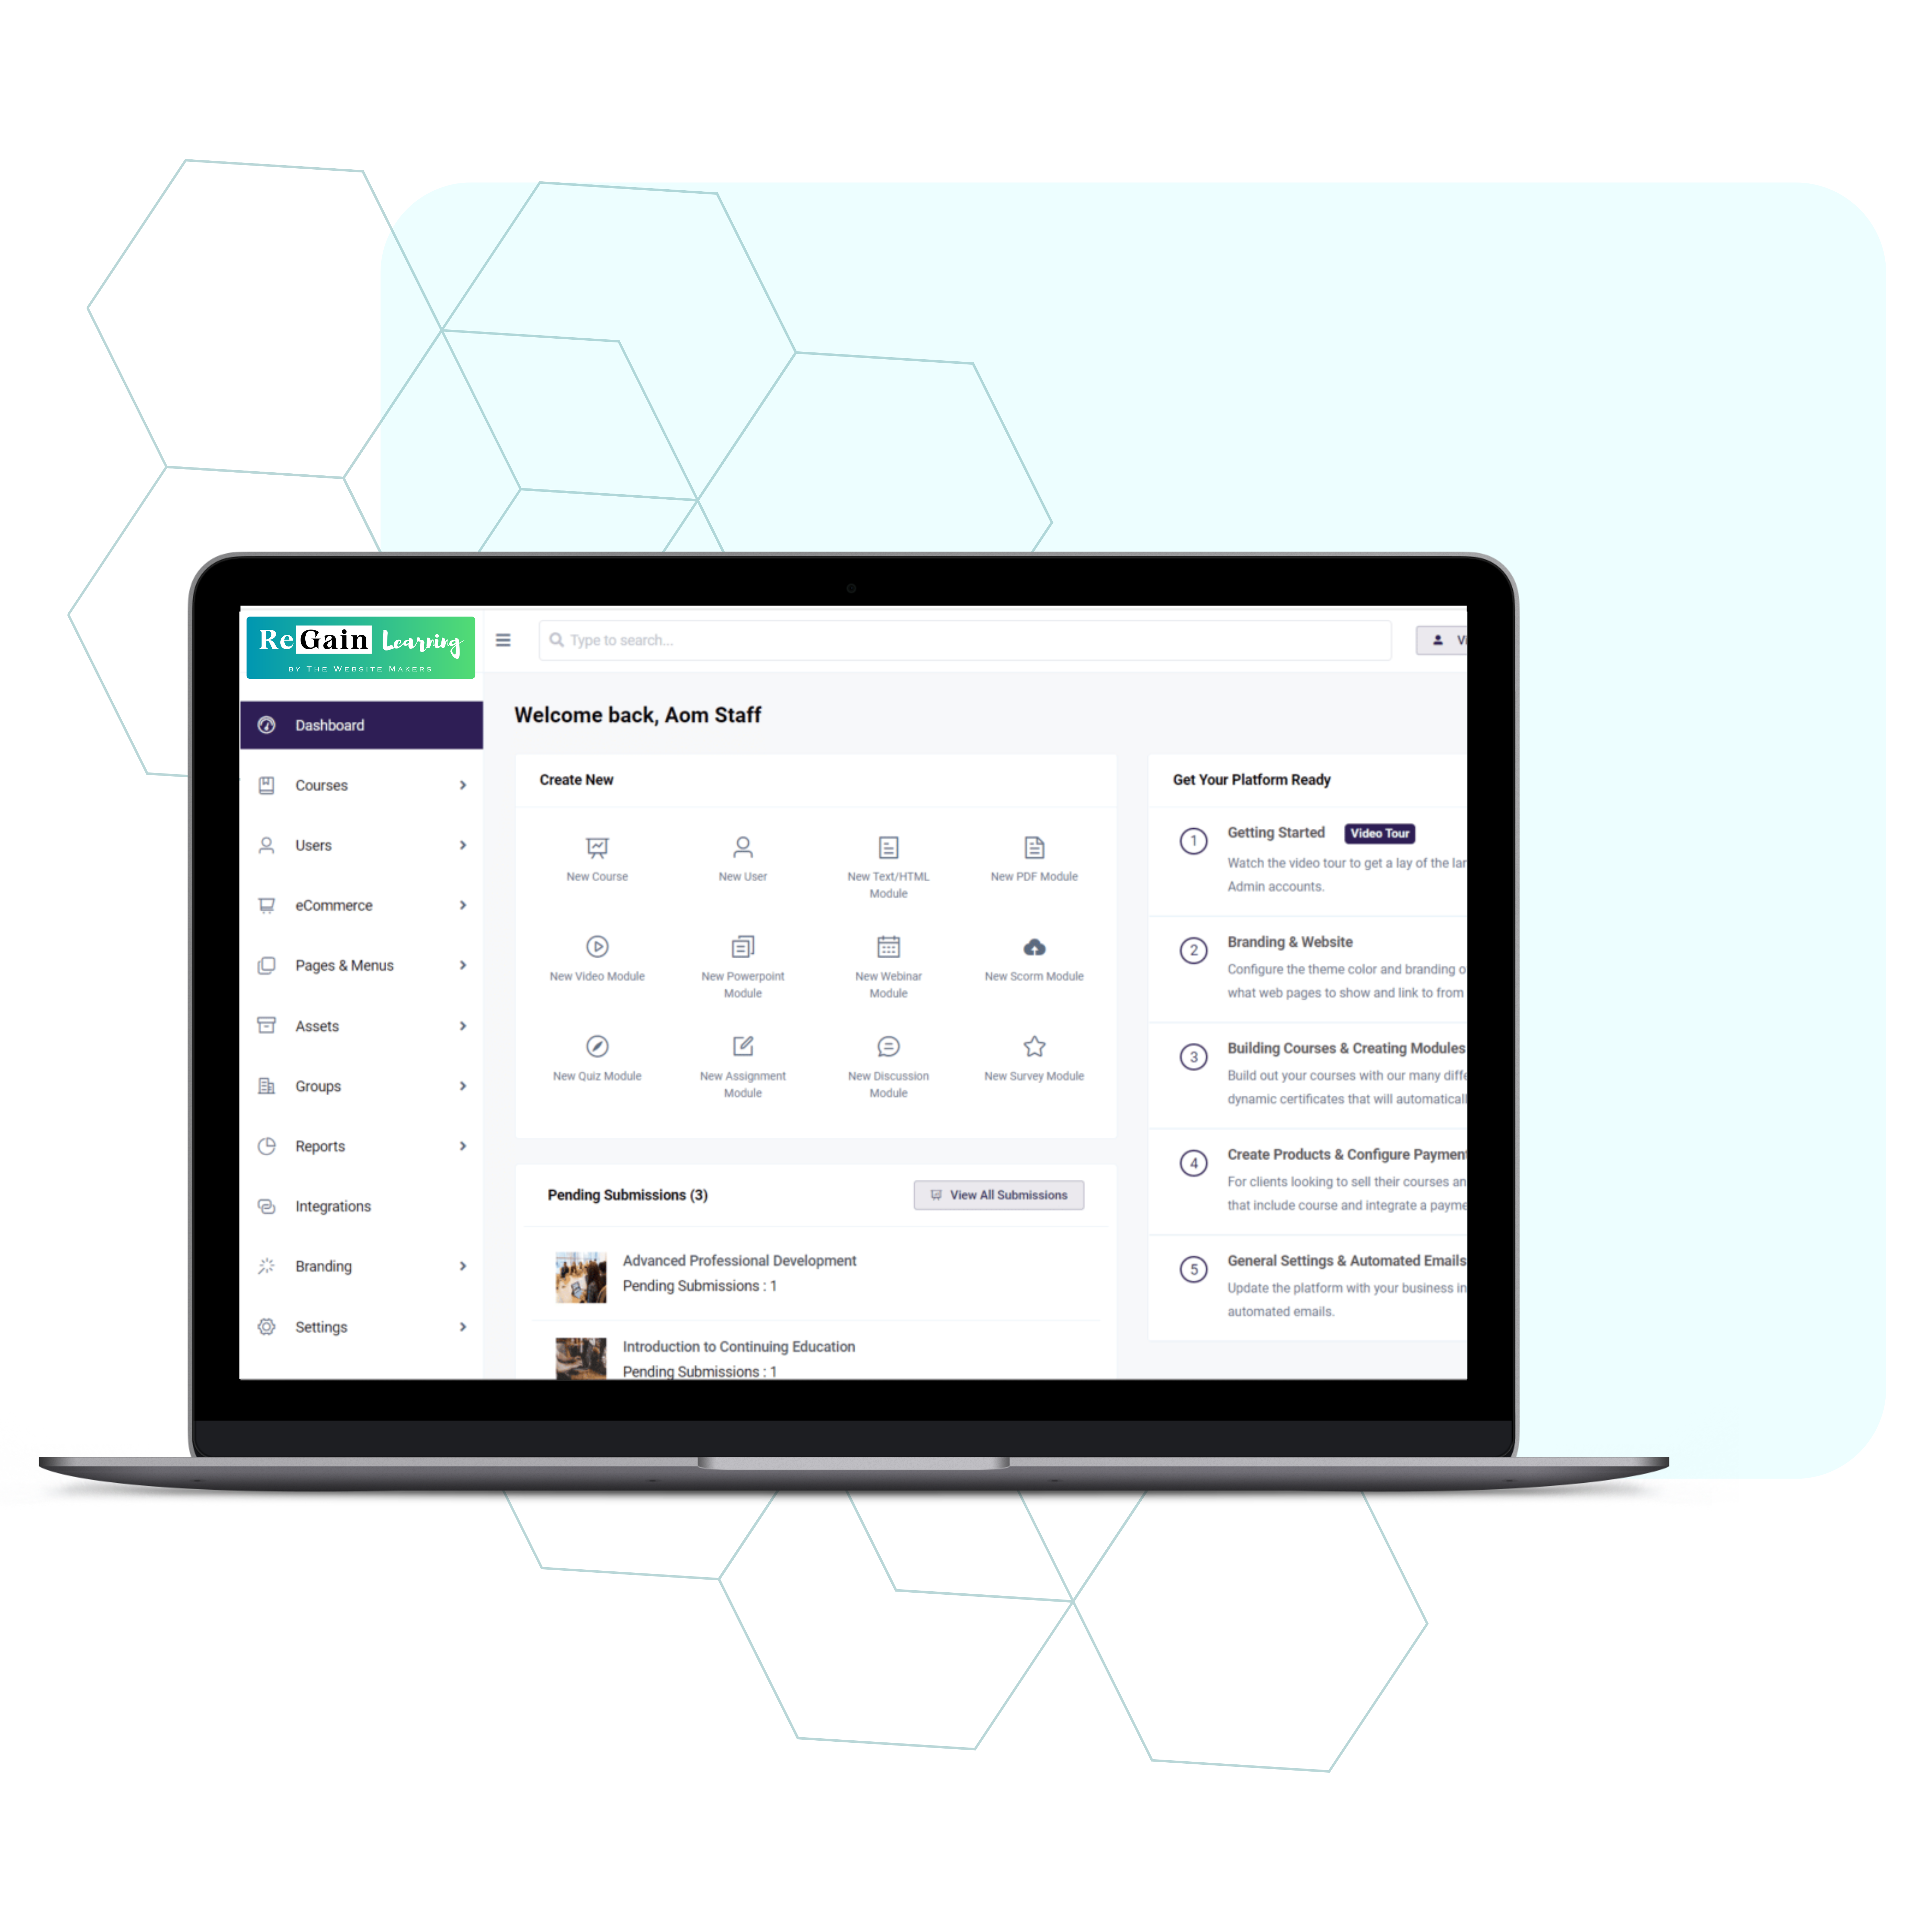
Master Power BI and take your data analytics skills to the next level! 🚀

  • Graduates seeking a job in data analytics

  • Working professionals transitioning to analytics

  • Engineers, commerce, MBA students entering tech roles

  • Business analysts upgrading with automation skills

  • Freelancers/consultants adding data services

You’ll be able to:

  • Clean, analyze, and visualize structured data

  • Build dashboards using Excel and Power BI

  • Write optimized SQL queries and Python scripts

  • Use AI tools to automate reports and code

  • Present data stories and prepare for interviews

  • Land analyst roles with confidence and clarity

ReGain Learning

Our alumni thrive globally, employed by 1500+ companies.

ReGain Learning

FAQs

No. We start from scratch—Excel, SQL, and Python are taught from the basics.

Yes. We offer job assurance with mock interviews, resume help, and referrals.

Absolutely. You'll learn ChatGPT, Copilot, Code Interpreter, and Python automation.

Dashboards, EDA reports, HR analytics, churn prediction, and more.

Yes. You’ll receive a Regain Learning certification + project badges + LinkedIn showcase.

We offer both self-paced learning with recorded materials and live instructor-led training for an interactive experience.

No strict prerequisites, but familiarity with Excel and databases will be helpful.

ReGain Learning

Learner's Reviews

Megha V BSc Mathematics

“I was a fresher with no coding knowledge. This course built me up from basics to project-ready. Got placed in 4 months!”

Prakash G Ex-Sales Executive

“After 6 years in sales, I was stuck. Regain Learning helped me switch to Data Analytics and land my first data job.”

Monica R Hyderabad

"Coming from BPO, I didn’t know I could become a data analyst. This course changed everything—tools, projects, interviews—they guided me all the way.”

Ravindra M Bengaluru

"My mechanical engineering degree wasn’t helping me. With this training, I finally got into IT as a BI Consultant.”

Sneha L MBA (Finance)

“As an MBA student, this program gave me real technical edge. It boosted my resume and helped me land a job before campus placement.”

Abdul R Career Switcher

"Learning ChatGPT and Copilot along with data tools gave me a unique edge in interviews. Recruiters were impressed with my portfolio.”

Kavitha T Remote Learner

“After a 4-year career break, this course gave me confidence and skills. Now I work remotely as a Data Analyst!”

Dev G Startup Founder

“I joined this program to support my startup with better data tracking. Ended up creating dashboards that saved us ₹2 lakhs/month.”

Bhavana K Pune

“I didn’t need to quit. After completing this course, I got promoted within my company and now handle analytics projects.”

Manoj S Delhi NCR

“Within 40 days of enrolling, I cracked an interview and joined a tech company as a Junior Analyst. All credit to the training and placement team!”

ReGain Learning

Need Help ?
Call :7892818284

We’re here to assist you on your learning journey. If you have any questions, need further information, or would like personalized assistance, please feel free to reach out.

Complete the form below, and our dedicated team will get back to you promptly.

Make an Enquiry.

Copyright © The Website Makers.

Resources

Reviews

Login

Get In Touch

☏ 78928 18284

✉ connect@regainlearning.com

⚐ MIG11, Housing Board Colony, Tadepalligudem, Andhra Pradesh

2nd floor, 1573, HSR Fly Over, Agara Village, 1st Sector, Koramangala, Bengaluru, Karnataka 560034, Bengaluru, Karnataka 560102

Quick Call